In this guide, you will learn how to get data that we used in Q1 Recap for your company.
First, create a table report, either in a new dashboard or an existing one.
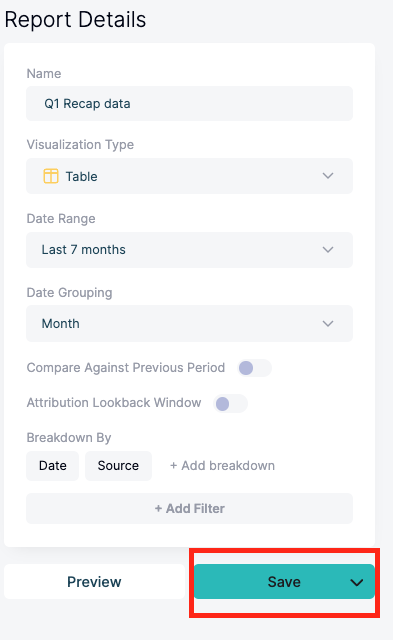
Once done, select the date range you want for your report. In the case of Q1 Recap report, we set up date range of “Last 7 Months” - it’s because the report was analyzed in April, and “Last 7 months” date range would allow me to get the data from October (beginning of Q4) until April (beginning of Q2).
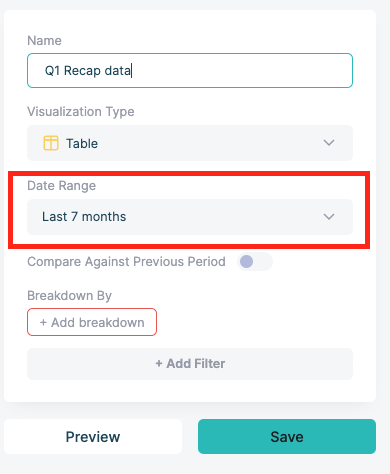
Alternatively, set up any date range you want, and you can change it later in the dashboard view once we create the report - to do so, once we finish the report, just select the time range in the top right corner of your screen.

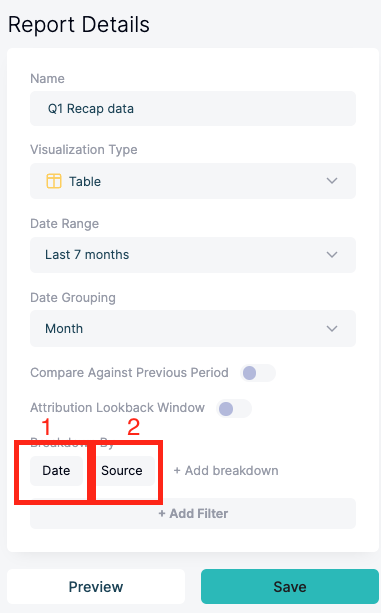
Next, let's add a breakdown by:
Date (1) - this will allow you to see data for a specific period of time. You can change the date grouping to days, weeks, quarters, or months. For the Q1 Recap report, we used quarterly and monthly grouping.
Source (2)- This will allow you to see data for your sources, for example, Facebook, LinkedIn, direct etc. (If you want to get more granular, add 2 more breakdowns: by UTM Source and UTM Medium)
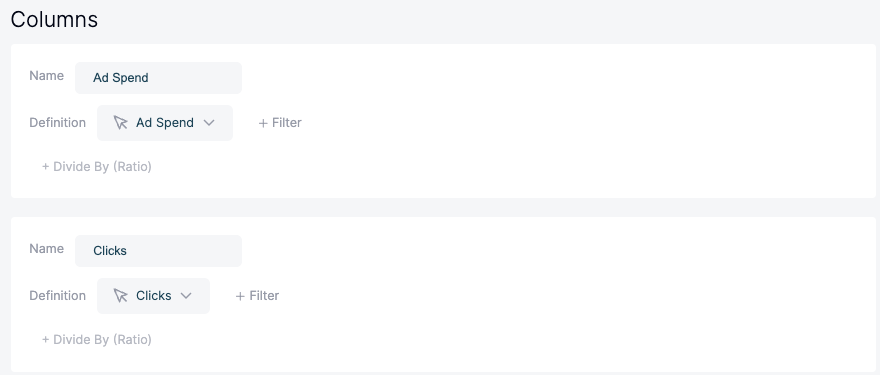
Next, let’s gather in-platform data.
Let’s add 2 columns, one with Ad Spend and one with Clicks (You could also add Impressions if you want)
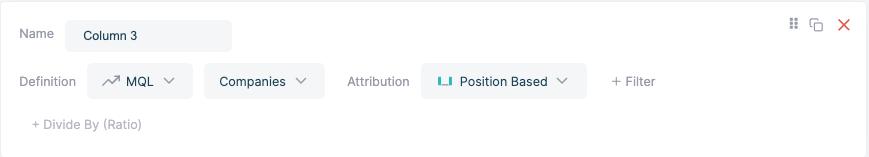
Next, let’s add MQLs (or Leads, Or what you define as leads at your company - HockeyStack allows for a high level of customization, so the definitions between different companies are not an issue, as you can define “lead” however you’d like).
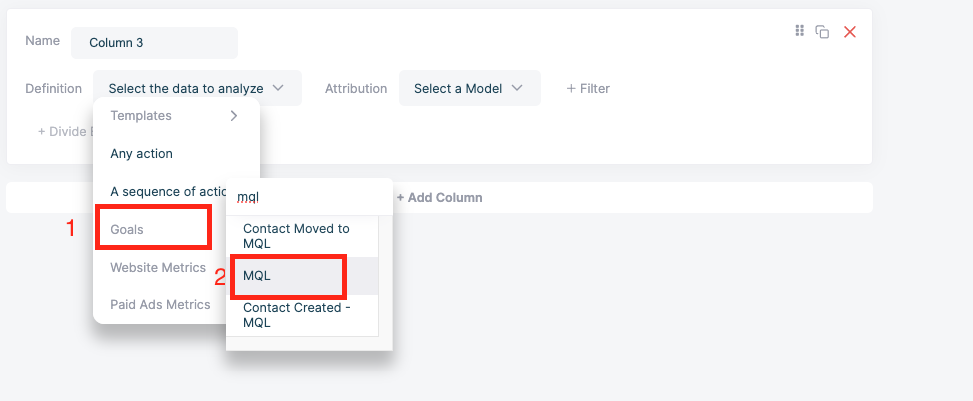
Next, you need to group it, depending on how you define your MQLs. In this example, I’ve grouped it by companies, meaning that it will show me how many companies became MQLs.
In terms of attribution model, you can choose how you wish to attribute MQLs to a specific source. For this example, I’ve chosen Position Based Attribution Model.
Next, we will need to get the data for SQLs (or however you define that stage). In our case, it’s Deal Created, Grouped by companies.
There are 2 ways in which you could approach it.
First, you could create a new column, add your SQL definition, Group it, and add the attribution model:
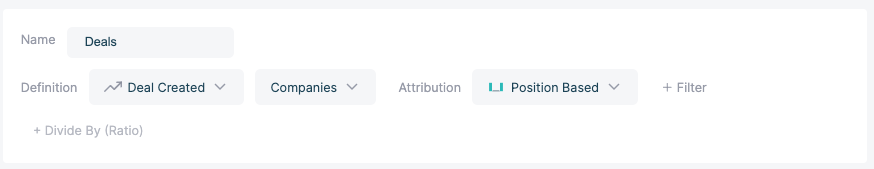
This way, every single touchpoint until was created (or SQL happened, or however you define that stage) will be accounted for when getting attribution credit.
However, if you want to account for touchpoints (sources) only until the the MQL was generated, then you will need to do a sequence of actions (full documentation can be found here).
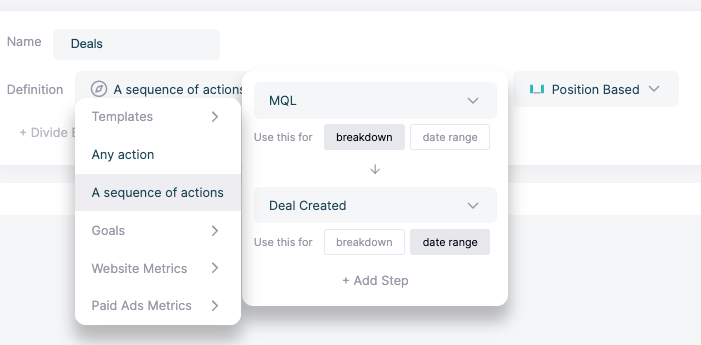
By doing it as a sequence of actions, you let HockeyStack know that:
- You want only to account for touchpoints until MQL - by setting it up as a 1st step and using it as a breakdown (cut-off point for attribution)
- You want to see data for SQLs/Deals created by putting it as your final step. By using Date Range for Deal Created (or SQLs, or however you define it at your company), you will see data only for the date range we’ve chosen for this report
For our recap, we used 2nd way of setting up the SQLs/Deals column, which helped us to account only for touchpoints until the MQL was generated.
With this set-up, leads could be captured at anytime in the past, and as they are defined as MQLs, we know that they are marketing generated. And we will be seeing deals(SQLs) for time period we’ve chosen.
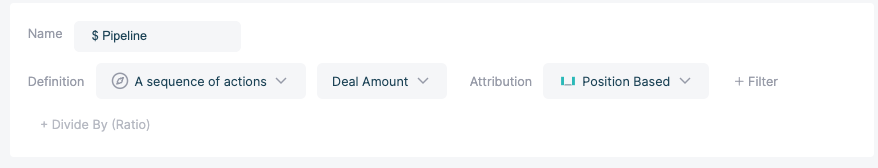
Next, Let’s see the pipeline generated.
The logic for this column is the same as for the column above (so using a sequence of actions), but instead of grouping it by companies, we will group it by Deal Value.
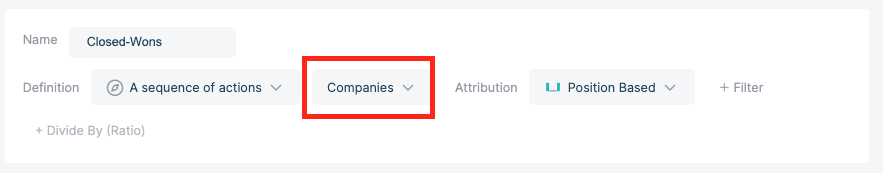
The next column shows the data for how many closed-won deals you have.
Again, define it either as Closed Won (if you want to account for all touchpoints until the deal was won), or as a sequence of actions (if you want to account only for touchpoints until MQL -that’s what we did)

Group it by Companies
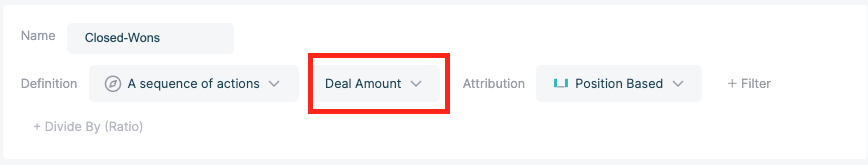
Next, in order to see the revenue, we will use the same set-up as we have for Closed-Wons, but this times we will group it by Deal Amount.
Now, when you click “Save”, your report will be created and saved.
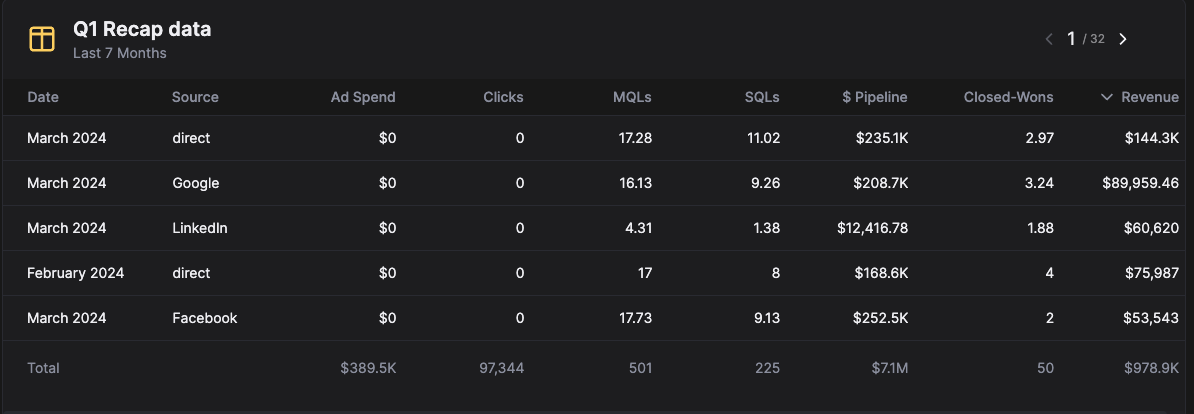
This is how the final report would look like (in a dark theme):
If you would like to create a calculated field, for example, to see MQL:SQL Conversion Rate, simply create a column when editing your report, and choose what do you want to calculate.
In this example, I want to get MQL:SQL Conversion Rate, so I need to:
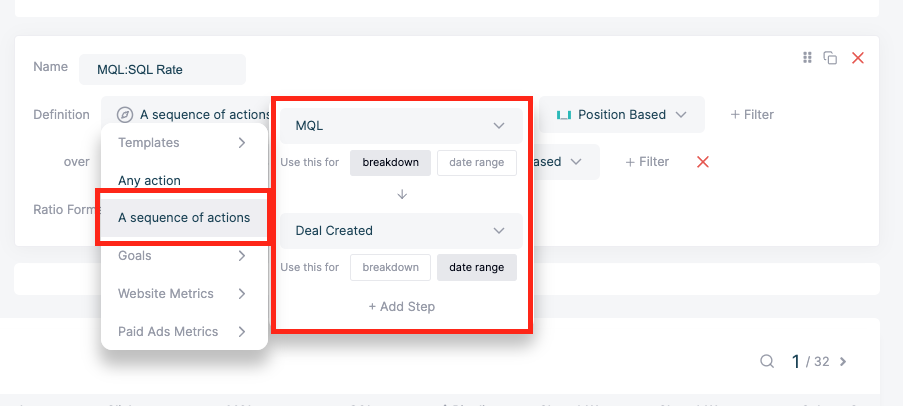
First, Create a sequence of actions, starting with MQL as a breakdown and Deal Created as a Date Range - this will allow me to get Deals data (that were MQLs before).
Next, let’s divide it by MQLs.
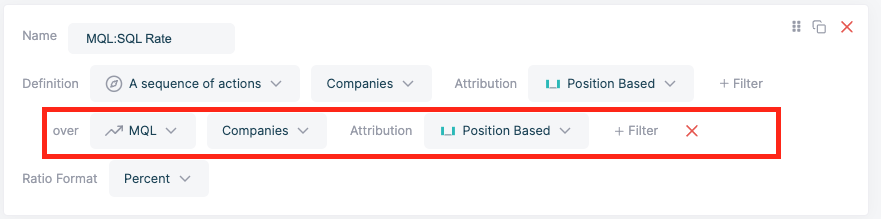
Finally, let’s choose ratio format as percent - and this is how you get MQL:SQL Rate in your report.