A report showing Conversion Rates and Pipeline Conversion of Pricing Page
In order to create this report, you will need to use your definitions for 2 goals:
- Conversion Event (Most likely: Demo Submitted, Visited Thank You Page, MQL)
- Pipeline definition (Most likely: Deal Created or Pipeline Created) and
HockeyStack is customisable in terms of how you define those goals and events, so it may vary depending on how you named them and defined them.
Next, you will need the URL of your pricing page (most likely: a URL that contains “pricing”).
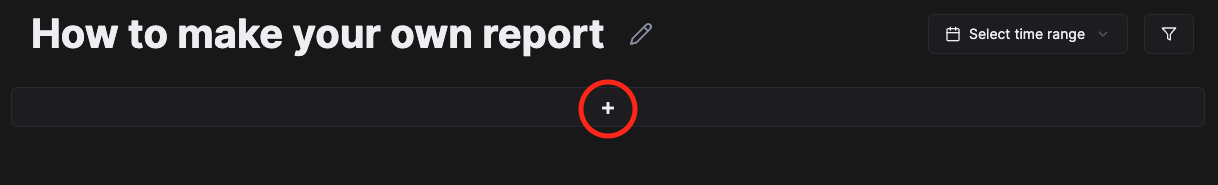
Once you have them handy, go to a dashboard (or create one), and click on “+” to create a new report.
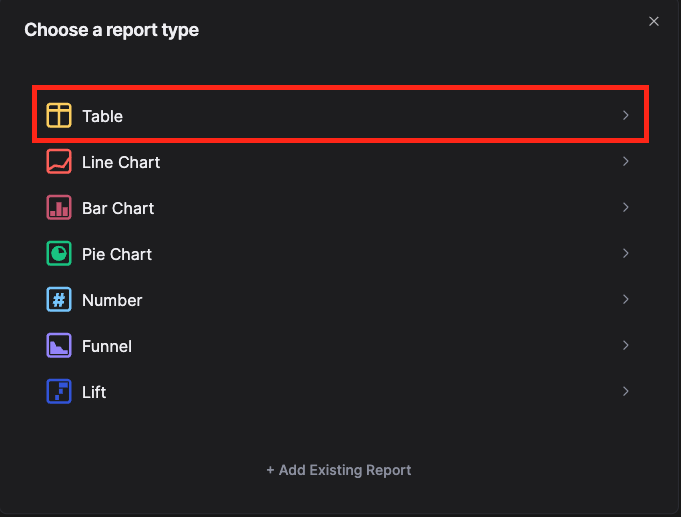
Next, choose the Table Report type.
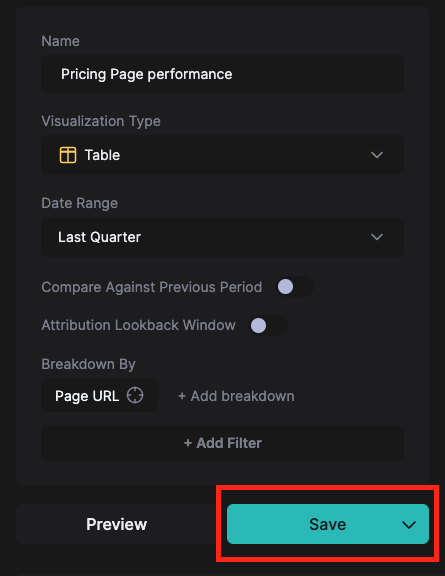
Next, add Name to the report (1), choose the date range you want to use (2), and add Breakdown by “Page URL” (3).. This will allow you to see the data for the page URL within a specific timeframe.
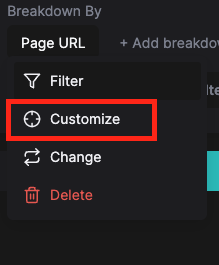
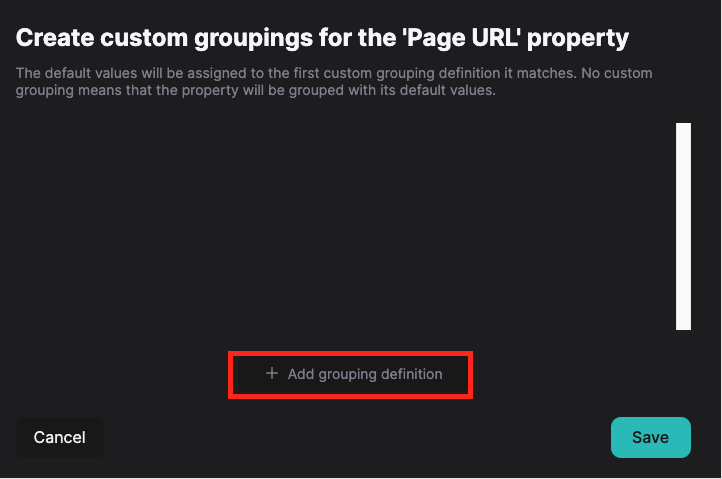
Next, click on “Page URL” and click “Customize” - this will allow us to group pages by pricing and by non-pricing pages based on their URL.
Next, we will add 2 grouping definitions.
In this example, the pricing page is domain.com/pricing/, so we group pages by containing that URL and not containing it.
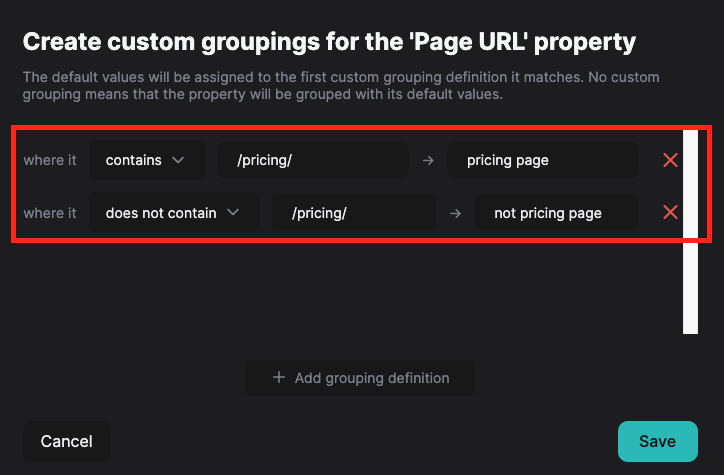
Next, press “Save”.
Now, let’s add 2 columns, first for direct conversion rate - using Last Touch attribution, meaning that someone converted directly from that website (in our case, the pricing page). Following that, we will look at pipeline conversion rate - again, Last Touch attribution to stay consistent across the report, meaning that the page (pricing page) led to Deal/Opportunity.
In order to do so, add 2 new columns by clicking “+ Add Column”

And repeat the below setup; just change the definitions of “Book a Demo” and Deal Created” to definitions that your company is using.
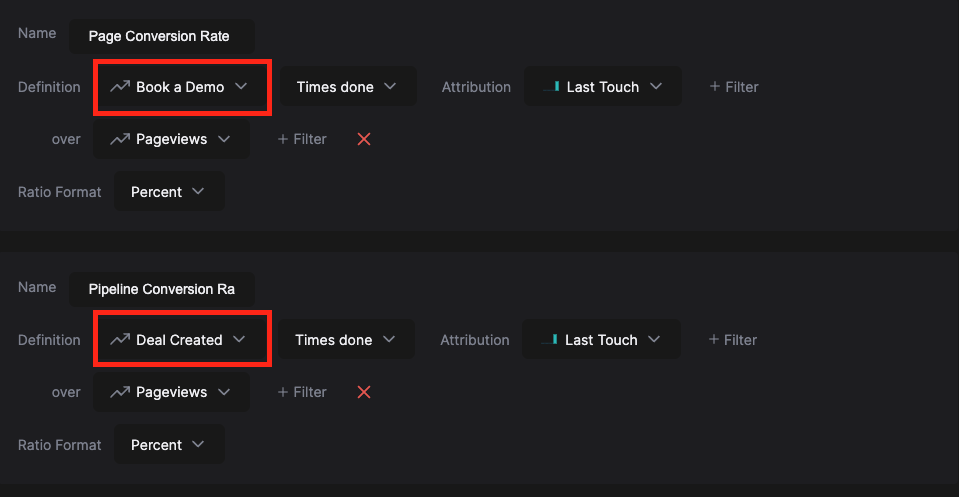
- If you expect to have multiple demo requests from the same account, but want to count them as 1, choose “Companies” instead of “Times Done”. If you expect to have the same person requesting multiple demos but want to count it as one, change “Times Done” to “Unique Users”*
Once you have done this setup, click “Save.”
And your report is ready; this is how it will look like
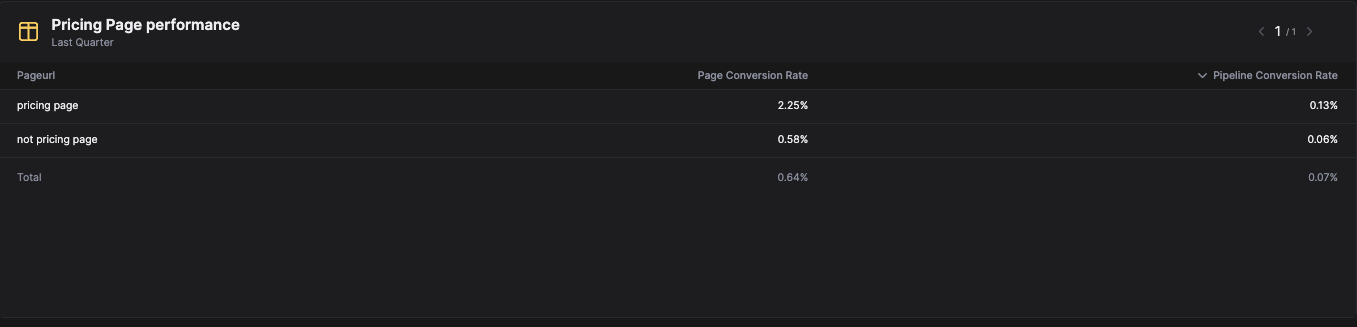
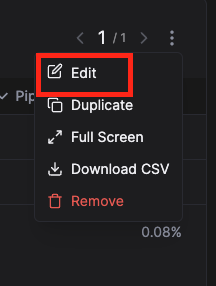
If you don’t want to see “not pricing page” data, let’s edit the report by clicking 3 dots in the top right corner and click “Edit” - this will allow us to edit the report we just created.
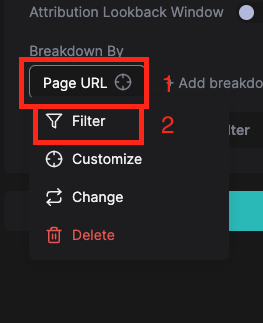
Now, all we need to do is click “Page URL” (1), and “Filter” (2).
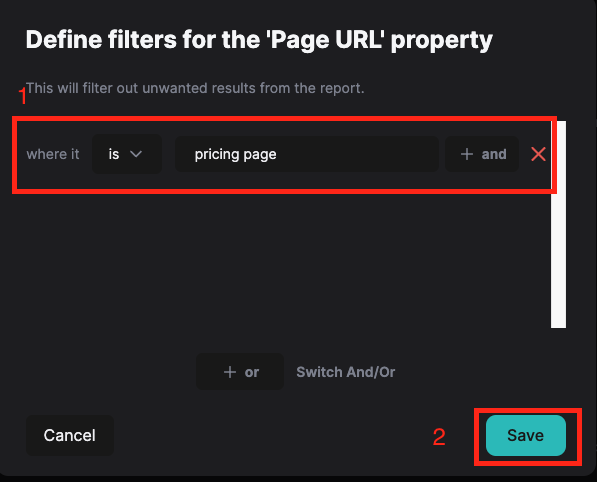
We want to display data only for pricing pages, so we have to use filter to show only them, by using a filter, where it is “pricing page” (1). Then, we save the report (2), and you will see only data for pricing pages.
A report showing the likelihood of outcome once the action happens/doesn’t happen - Lift Analysis.
In order to create a lift report, we will have to set up 2 goals.
In our case, the goal will be “View pricing page”, defined as a user or company viewing a page containing “/pricing/” in their URL.
Thanks to setting this goal, HockeyStack will be able to analyse conversion impact against the anti-cohort - for users/companies that haven’t seen those pages/goals.
For your organisation, the URL paths may be different and should be adjusted if needed.
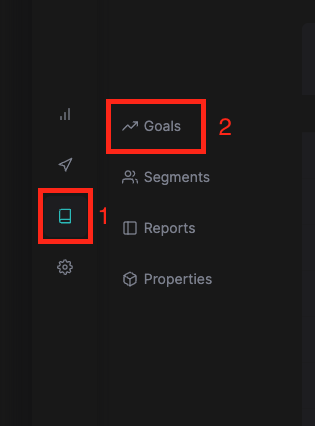
In order to create a new goal, go to “Definitions” (1) on the left-hand side, and click “Goals” (2)
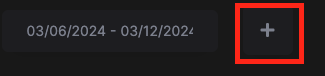
Next, click “+” in the top right corner
Select the category where you want to put that goal in (1), and name it (2). Then, enter the URL path (3) of your pricing page. In the example below, we know that the pricing page is a page that is exactly hockeystack.com/pricing/.
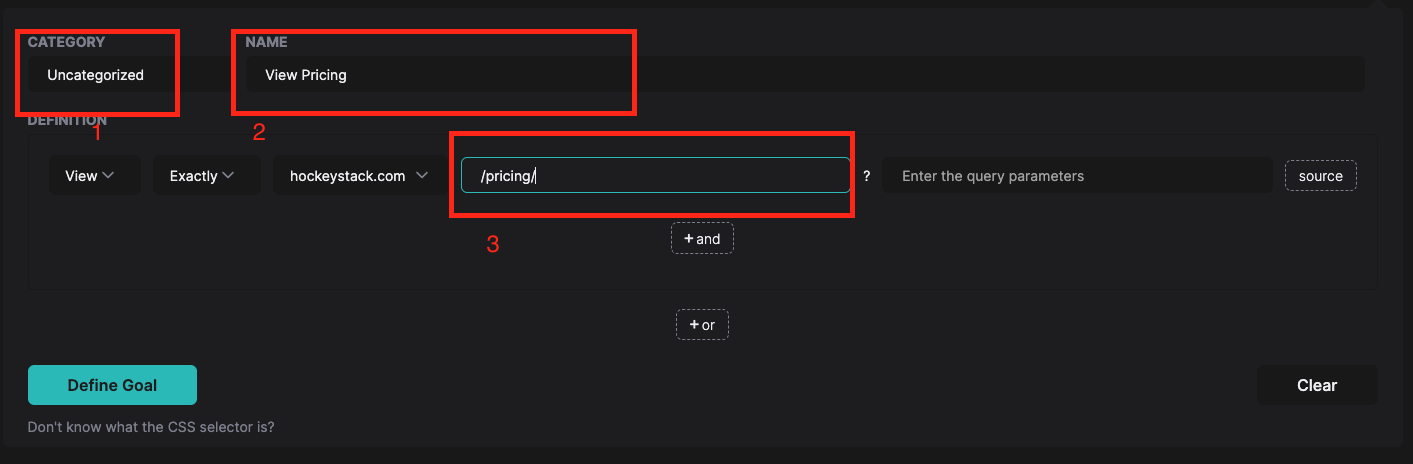
Once done, click “Define Goal”
Now let’s get back to the dashboard and create a new report.
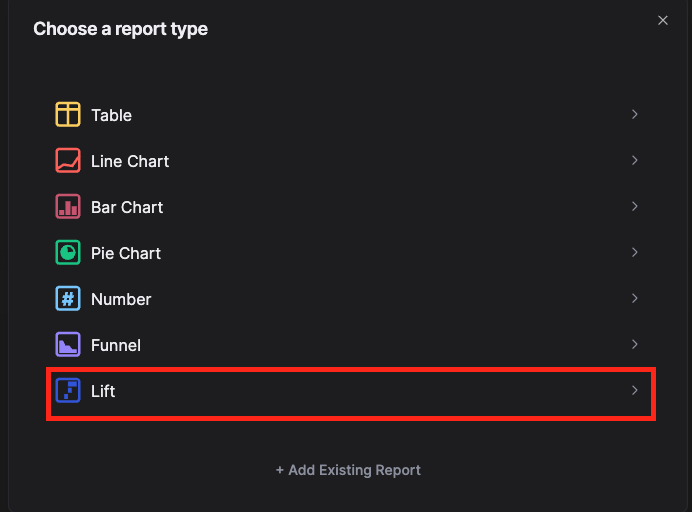
This time, we will choose the Lift Report
Next, let’s name the report (1), Group it by Unique Users if it is an action that an individual takes, like booking a demo; group it by Companies if it is an action that a company takes, like creating an opportunity (2), and select the date range (3).
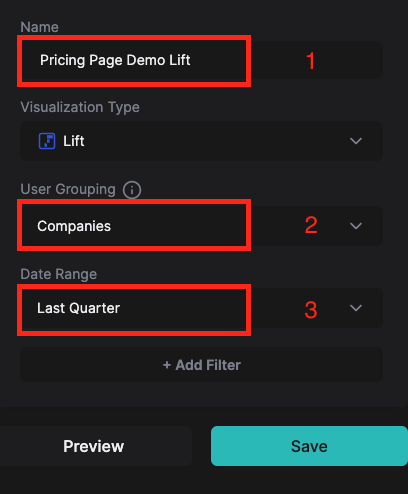
Followed by that, let’s name the lift (1), and select (2) Goal that we just created - View Pricing.
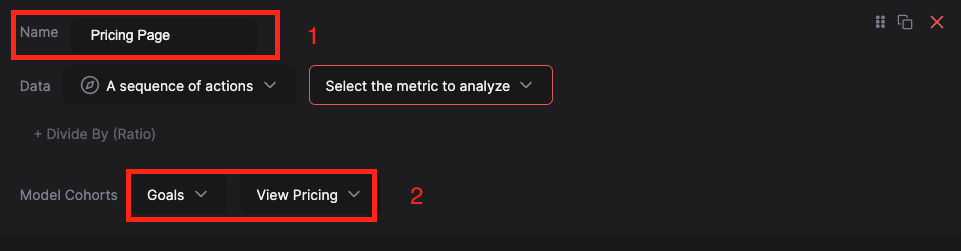
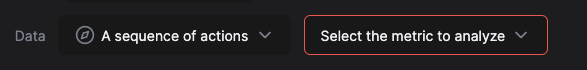
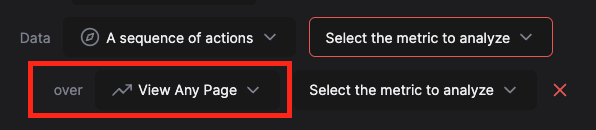
Next, in Data, we will select a Sequence of actions. Data is the conversion rate that we want to analyze. In this case, we are looking at the demo booking or deal creation conversion rate after pageview. So we should be looking at the number of book a demo or deals, divided by the number of page visitors.
In the sequence of actions, we will be selecting: View Any Page - and using it as a breakdown, and our Book a Demo Goal, using it as a Time Range.
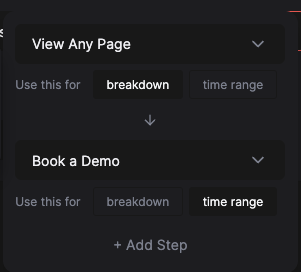
Once we set up the sequence, we will be dividing it by “View Any Page”.
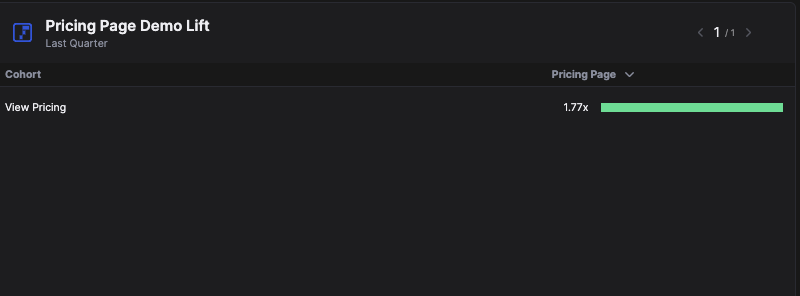
Finally, save the report, and your uplift report is ready -in the below example, the report shows that visitors who have seen the pricing page are 177% more likely to convert into a demo booking/opportunity than the ones who haven't seen the pricing page.
If you would like to do this report for any other pages or actions, for example, lift of case studies on conversion, all you need to do is create a new goal, and then make a lift report like above, but with a cohort of the goal you just created.
Lift Report documentation can be found here.
Sequences documentation can be found here.
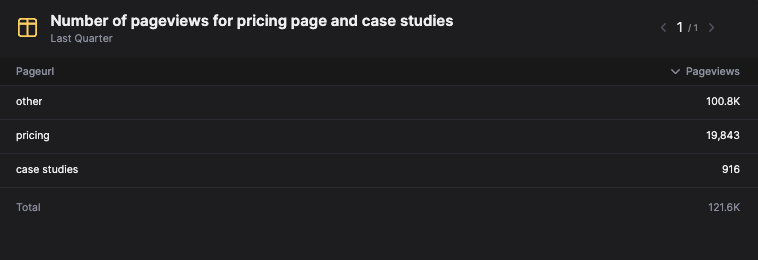
Website visits by URL or type of pages
In order to see the number of page views, unique users, or any metrics related to a specific page or group of pages (for example, case studies or pricing pages), we will create a new table report.
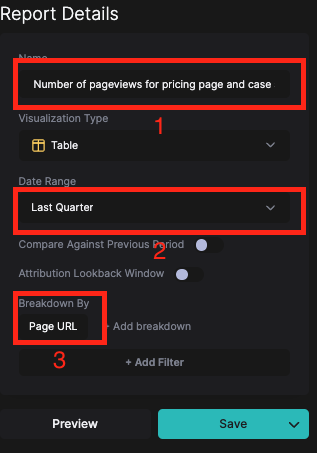
Within that table report, we will name it (1), select the date range (2), and break it down by URL (3).
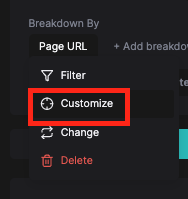
Then, we will customise the breakdown to group page URLs based on their address.
In this example, will create 3 groupings: one for pricing page pageviews (1), one for case studies pageviews (2) , and one for all other pageviews (3, in this example, I defined it as If does not contain pricing, then show as “other”, but you could use a different definition)
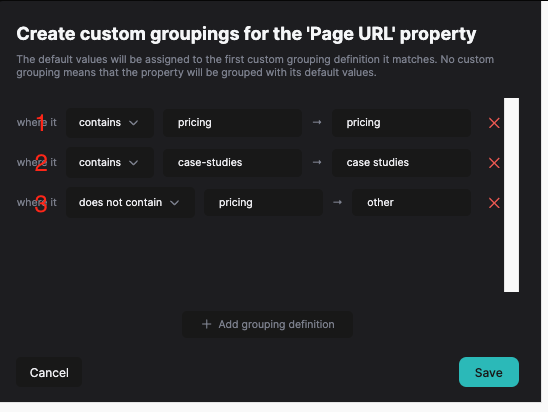
Once done, click “Save.”
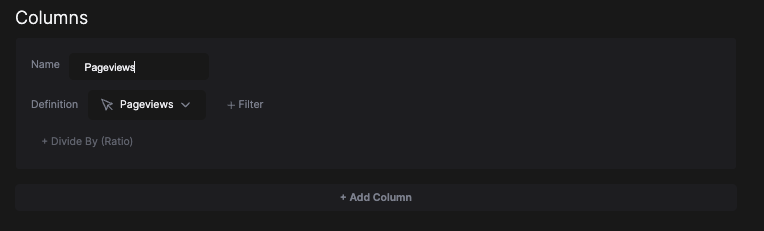
Next, in columns, we will add a column showing pageviews.
Now, if you click “Save” you will save the dashboard, and this is the final outcome.